
 [5 minute read, open as pdf] Sign up for our upcoming CPD webinar on diversifying income risk Summary
Dividend concentration risk is not new, just more visible A number of blue chip companies announced dividend reductions or suspensions in response to financial pressure wrought by the Coronavirus outbreak. This brought into light the dependency, and sometimes over-dependency, on a handful of income-paying companies for equity income investors. For UK investors in the FTSE 100, the payment of dividends from British blue chip companies provides much of its appeal. However a look under the bonnet shows a material amount of dividend concentration risk (the over-reliance on a handful of securities to deliver a dividend income). On these measures, 53% of the FTSE 100’s dividend yield comes from just 8 companies; whilst 22% of its dividend yield comes from energy companies. The top 20 dividend contributors provide 76% of the dividend yield. We measure dividend concentration risk by looking at the product of a company’s weight in the index and its dividend yield, to see its Contribution to Yield of the overall index. Fig.1. FTSE 100 Contribution to Yield, ranked 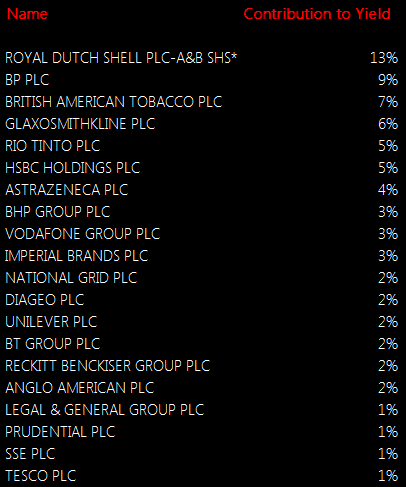 Source: Elston research, Bloomberg data, as at June 2020 Quality of Income More important than the quantity of the dividend yield, is its quality. As income investors found out this year, there’s a risk to having a large allocation to a dividend payer if it cuts or cancels its dividend. Equally, there’s a risk to having a large allocation to a dividend payer, whose yield is only high as a reflection of its poor value. Screening for high dividend yield alone can lead investors into “value-traps” where the income generated looks high, but the total return (income plus capital growth) generated is low. Contrast the performance of these UK Equity Income indices, for example. Fig.2. UK Equity Income indices contrasted 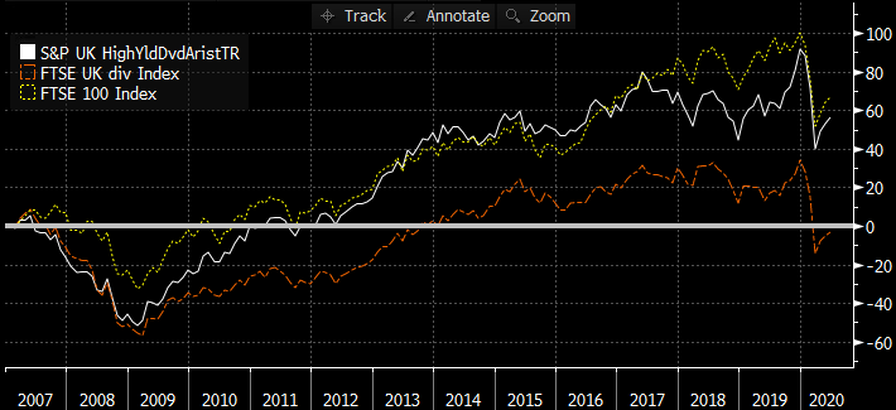 Source: Elston research, Bloomberg data. Total returns from end December 2006 to end June 2020 for selected UK Equity Indices. Headline Yield as per Bloomberg data as at 30th June 2020 for related ETFs. The headline yield for the FTSE UK Dividend+, FTSE 100 and S&P UK Dividend Aristocrat Indices was 8.10%, 4.44%, and 4.07% respectively as at end June 2020. However, the annualised long-run total return (income plus capital growth) 1.03%, 4.29% and 4.82% respectively. Looking at yield alone is not enough. The dependability of the dividends, and the quality of the dividend paying company are key to overall performance. Mitigating dividend concentration risk: quality yield, with low concentration The first part of the solution is to focus on high quality dividend-paying companies. One of the best indicators of dividend quality is a company’s dividend policy and track record. A dependable dividend payer is one that has paid the same or increased dividend year in, year out, whatever the weather. The second part of the solution is to consider concentration risk and make sure that companies’ weights are not skewed in an attempt to chase yield. This is evident by contrasting the different index methodologies for these equity income indices. The FTSE 100 does not explicitly consider yield (and is not designed to). The FTSE UK Dividend+ index ranks companies by their dividend yield alone. The S&P UK Dividend Aristocrats only includes companies that have consistently paid a dividend over several years, whilst ensuring there is no over-dependency on a handful of stocks. A look at the top five holdings of each index shows the results of these respective methodologies. Fig.3. Top 5 holdings of selected UK equity indices 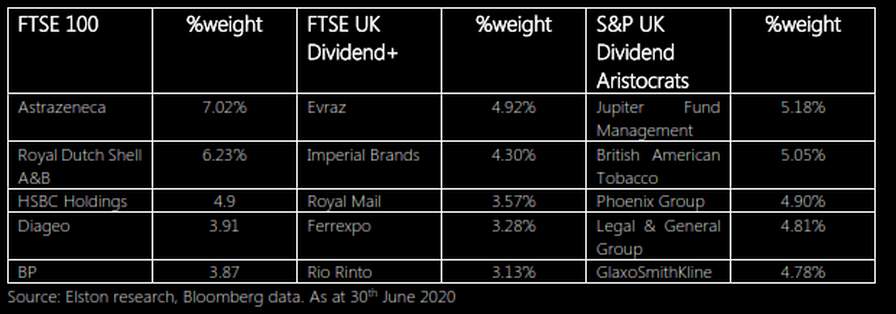 Put simply, the screening methodology adopted will materially impact the stocks selected for inclusion in an equity income index strategy. What about active managers? A study by Interactive Investor looked at the top five most commonly held stocks in UK Equity Income funds and investment trusts. For funds, the most popular holdings were GlaxoSmithKline, Imperial Brands, BP, Phoenix Group & AstraZeneca. For investment trusts, the most popular holdings are British American Tobacco, GlaxoSmithKline, RELX, AstraZeneca and Royal Dutch Sell. Unsurprisingly, each of the holdings above is also a constituent of the S&P Dividend Aristocrats index, hence ETFs that track this index simply provide a lower cost way of accessing the same type of company (dependable dividend payers with steady or increasing dividends), but using a systematic approach that enables a lower management fee. Understanding what makes dividend income dependable for an asset class such as UK equities, is only part of the picture of mitigating income risk. Income diversification is enabled by adopting a multi-asset approach. The advantage of a multi-asset approach The advantage of a multi-asset approach is two-fold. Firstly the ability to diversify equity income by geography for a more globalised approach, to benefit from economic and demographic trends outside the UK. Secondly the ability to diversify income by asset class, to moderate the level of overall portfolio risk. For investors who never need to dip into capital, have a very high capacity for loss, and can comfortably suffer the slings and arrows of the equity market, equity income works well – so long as the quality of dividends is addressed, as above. But for anyone else, where there is a need for income, but a preference for a more balanced asset allocation, a multi-asset income approach may make more sense. The rationale for a multi-asset approach is therefore to capture as much income as possible without taking as much risk as an all-equity approach. Value at Risk vs Income Reward There is always a relationship between risk and reward. For income investors, it’s no different. To be rewarded with more income, you need to take more risk with your capital. This means including equities over bonds, and, within the bonds universe, considering both credit quality (the additional yield from corporate and high yield bonds over gilts), and investment term (typically, the longer the term, the greater the yield). This overall level f risk being taken can be measured using a Value at Risk metric (a “worst case” measure of downside risk). If you want something with very low value-at-risk, shorter duration gilts can provide that capital protection, but yields are very low. Even nominally “safe” gilts, with low yields, nonetheless have potential downside risk owing to their interest rate sensitivity (“duration”). UK Equities offer a high yield, but commensurately also carry a much higher downside risk. The relationship between yield and Value-at-Risk (a measure of potential downside risk) is presented below. Fig.4. Income Yield vs Value at Risk of selected asset classes/indices 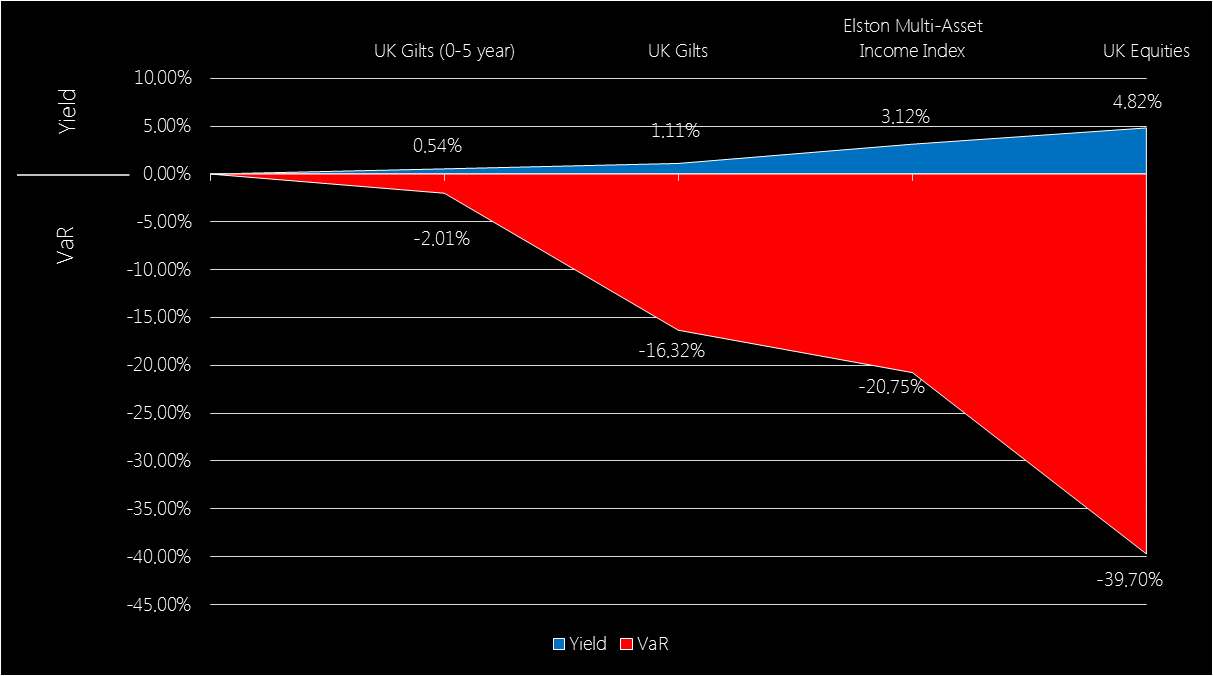 Source: Elston research, Bloomberg data, as at 30th June 2020. Note: an investment with a Value at Risk (“VaR”) of -10% (1 year, 95% Confidence) means there is, to 95% confidence (a 1 in 20 chance), a risk of losing 10% of the value of your investment over any given year. Asset class data reflects representative ETFs.
Our Multi-Asset Income index has, unsurprisingly, a risk level between that of gilts and equities, and captures approximately 65% of the yield, but with only 52% of the Value-at-Risk. Summary How you get your income – whether from equities, bonds or a mix – is critical to the amount of risk an investor is willing and able to take, and is a function of asset allocation. Understanding the asset allocation of an income funds is key to understanding its risks (for example, Volatility, Value at Risk and Max Drawdown). The dependability of dividend income you receive - whether from value traps or quality companies; whether concentrated or diversified – is a function of security selection. This can be either manager-based (subjective), or index-based (objective). For investors requiring a dependable yield, a closer look at how income is generated – through asset allocation and dividend dependability – is key. 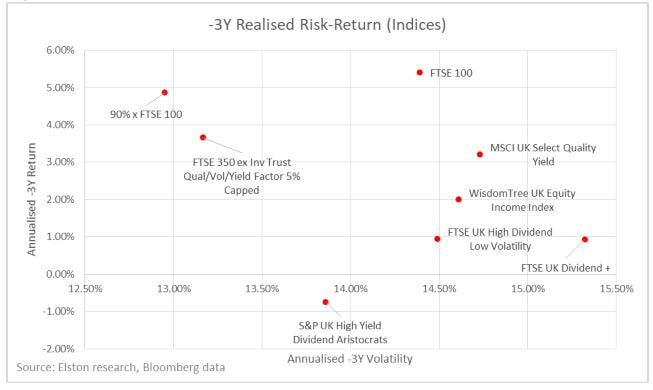 Following our initiation of overage of the UK Equity Income Index/ETF universe (data to 4q17), we have updated the data for 1q18 performance update for selected indices.
Returns For 1q18, the most defensive UK Equity Income index was the MSCI UK Select Quality Yield, tracked by ZILK, at -5.49% compared to -7.21% for the FTSE 100. On a 1Y basis, 90%xFTSE 100 returned +0.2% tracked by ZWUK, followed by -0.24% MSCI UK Select Quality Yield tracked by ZILK has performed best. On a 3Y basis our proxy benchmark for ZWUK, which takes 90%xFTSE100, returned +15.4%,, followed by +11.4% for FTSE 350 ex Inv Trust Qual/Vol/Yield Factor 5% Capped tracked by DOSH. Risk Adjusted On a 3Y basis, 90%xFTSE 100 as a proxy for the benchmark tracked by ZWUK, followed by FTSE 350 ex Inv Trust Qual/Vol/Yield Factor 5% Capped tracked by DOSH, have delivered best risk-adjusted returns. Correlation On a 3Y basis, the FTSE UK High Dividend Low Volatility Index tracked by UKHD offers most differentiated returns relative to the FTSE 100 (lowest beta and correlation). Gross Dividend Yield Over the last year WUKD has offered the highest historic dividend yield. View Report Learn about ETF Research Visit SEARCH ETF<Go> on the Bloomberg Terminal [5 min read]
Measuring the beta of an ETF relative to an index is a measure of a fund’s volatility relative to the volatility of its respective index. The beta of an ETF relative to the index it tracks should be close to 1.00. Measuring the correlation of an ETF relative to an index measures the degree to which the fund and index move in relation to each other. The correlation of an ETF relative to the index it tracks should be close to 100%. From a portfolio construction perspective, the correlation of an ETF is important not only to the asset class it relates to, but also to the other components of a portfolio. The decision whether to select a high beta/high correlation, or a low beta/low correlation ETF depends on investor preferences as regards portfolio construction. For investors looking to substitute traditional UK equity cap-weighted exposure (e.g. FTSE 100) with a higher income alternative, without seeking to alter the risk-return characteristics of the portfolio, the ETF selection process should consider ETFs with a Beta and Correlation that is closest to the FTSE 100. For investors looking to supplement or mitigate that same exposure, but with a higher income alternative, whilst seeking also to alter the risk-return characteristics of the portfolio for diversification purposes, the ETF selection process should consider ETFs with a Beta and Correlation that is furthest from the FTSE 100. In the chart below we plot the different UK Equity Income indices historic 3 year Beta and Correlation relative to the FTSE 100. 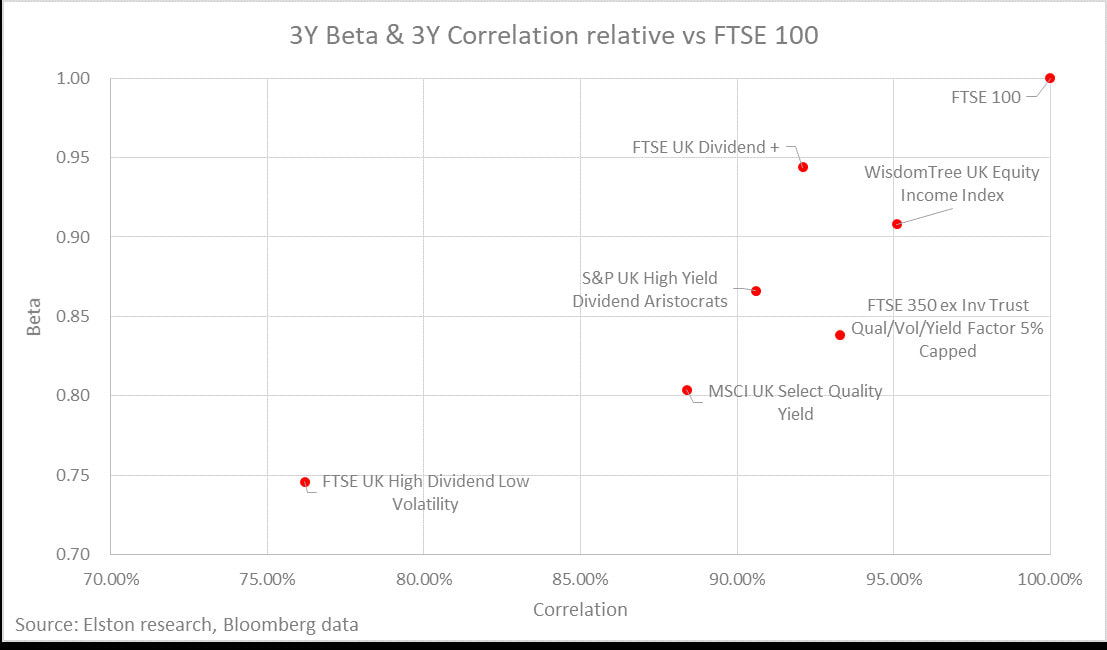 Choosing the right index/ETF depends on portfolio construction preferences
For investors wanting UK equity income exposure most similar to the FTSE 100, the best options are, on the basis of historic correlation and beta:
There are a range of options for investors seeking exposure to UK Equity Income. Whether to include an ETF/index exposure with higher correlation to the FTSE 100 for consistency purposes, or with a lower correlation to the FTSE 100 for diversification purposes is an active choice. [ENDS]
UK Equity Income Indices Investors have a choice of UK Equity Income index strategies, each with different risk-return characteristics, weightings methodologies and factor tilts. These difference influence the performance of each index strategy (all figures below are on a total return basis for GBP investors). Best performing for 2017 The best performing strategies for UK Equity Income in 2017 were:
This compares to +12.3% for FTSE 100 (best tracked by HSBC FTSE 100 UCITS ETF (LON:HUKX)). Best performing over last 3 years The best performing strategies for UK Equity Income over the last 3 years were:
This compares to +31.5% cumulative return for FTSE 100 (best tracked by HSBC FTSE 100 UCITS ETF (LON:HUKX)). Fig. 1: Total Returns (Cumulative) by strategy/index (cumulative, GBP terms) 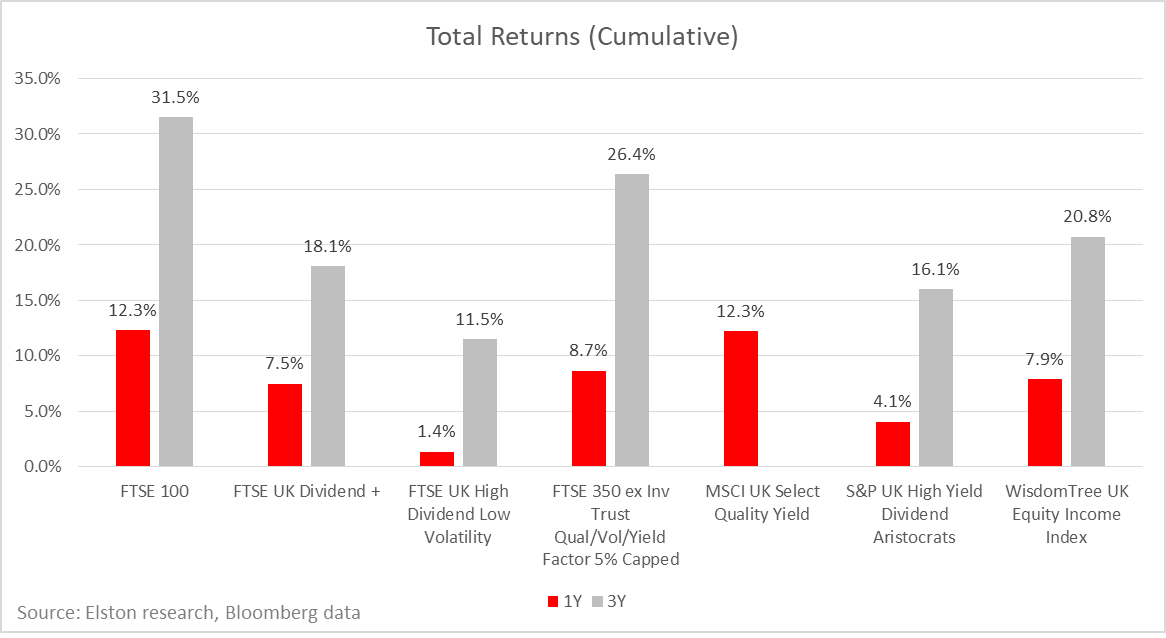 Best risk-adjusted returns The best risk-adjusted returns in 2017 of available UK Equity Income indices was achieved by:
To look at consistency of risk-adjusted returns, we have plotted 1Y Sharpe ratios vs 3Y Sharpe ratios for each UK Equity Income index strategy in Fig.2 below. Fig.2. 1Y & 3Y Sharpe Ratios, selected UK Equity Income index strategies (GBP terms) 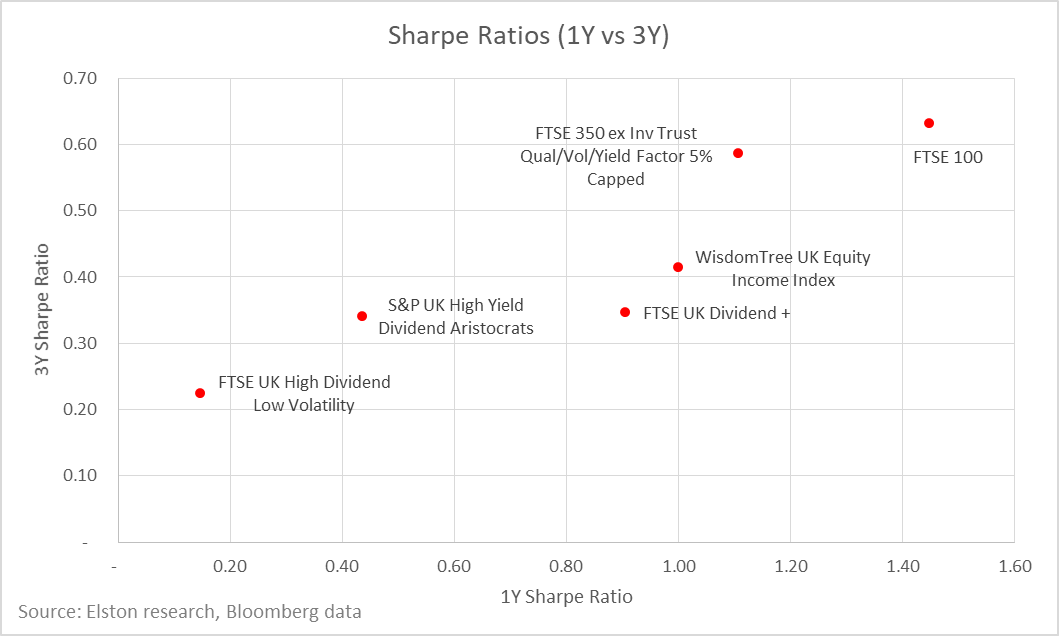 Conclusion Different index construction methodologies has a material impact on performance outcomes – both in absolute terms and on a risk-adjusted basis. A naïve interpretation is to consider performance in isolation, however our view is that index selection is more nuanced than that: it should relate to the objectives and constraints of individual client portfolios and the desired exposure - on asset-basis, risk-basis and factor-basis and the interaction between the selected strategy and the rest of a client portfolio. Note: Scope of our comparison For these reports, we have analysed the indices and ETFs detailed in Fig.3. Fig. 3: UK Equity Income Indices & ETFs vs HSBC FTSE 100 UCITS ETF (LON:HUKX)  [ENDS]
NOTICES: I/we have no positions in any stocks mentioned, and no plans to initiate any positions within the next 72 hours. I wrote this article myself, and it expresses my own opinions. I am not receiving compensation for it. This article has been written for a US and UK audience. Tickers are shown for corresponding and/or similar ETFs prefixed by the relevant exchange code, e.g. “NYSEARCA:” (NYSE Arca Exchange) for US readers; “LON:” (London Stock Exchange) for UK readers. For research purposes/market commentary only, does not constitute an investment recommendation or advice, and should not be used or construed as an offer to sell, a solicitation of an offer to buy, or a recommendation for any product. This blog reflects the views of the author and does not necessarily reflect the views of Elston Consulting, its clients or affiliates. For information and disclaimers, please see www.elstonconsulting.co.uk Photo credit: N/A; Chart credit: Elston Consulting; Table credit: Elston Consulting All product names, logos, and brands are property of their respective owners. All company, product and service names used in this website are for identification purposes only. Use of these names, logos, and brands does not imply endorsement. Chart data is as at 30-Dec-17
UK Equity Income ETF Choices Investors have a choice of UK Equity Income index strategies, each with different risk-return characteristics, weightings methodologies and factor tilts. Portfolio managers and advisers considering a UK Equity Income ETF should understand the differences of each to inform their selection process. In the first of a series of studies of this key sector, we have done a sector analysis of London-listed UK Equity Income ETFs, to understand their inherent characteristics relative to the UK main equity index, the FTSE 100. For these studies, we have analysed the indices and ETFs detailed in Fig.1. Fig. 1: UK Equity Income Indices & ETFs vs HSBC FTSE 100 UCITS ETF (LON:HUKX) 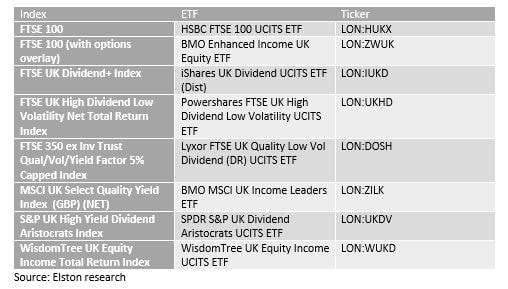 Methodology impact on sector allocation The result of the application of various index methodologies to the UK equities opportunity set materially impacts the sector exposures of available Equity Income ETFs. In some cases, sector caps form part of the index rules. In other cases they do not. For example, the FTSE100’s bias to Energy and Financials is well documented. For some Equity Income strategies, such biases are mitigated or even eliminated. Selecting the right Equity Income ETF for the business cycle For investors that focus on the business cycle, we have analysed the available UK Equity Income ETFs by GICS sectors, and classified those GICS sectors into two broad groups – Cyclicals and Defensives. This enables us to rank UK Equity Income ETFs by their exposure to the business cycle. On this basis, investors wanting access to UK Equity Income with a Cyclical bias (coloured red in Fig.2. below), should consider (in order) LON:WUKD, LON:IUKD, and LON:HUKX. Conversely, investors wanting access to UK Equity Income with a Defensive bias (coloured grey in Fig.2. below), should consider (in order) LON:DOSH, LON:UKDV and LON:ZILK. Fig. 2: UK Equity Income ETFs by Sector Allocation vs HSBC FTSE 100 UCITS ETF (LON:HUKX) 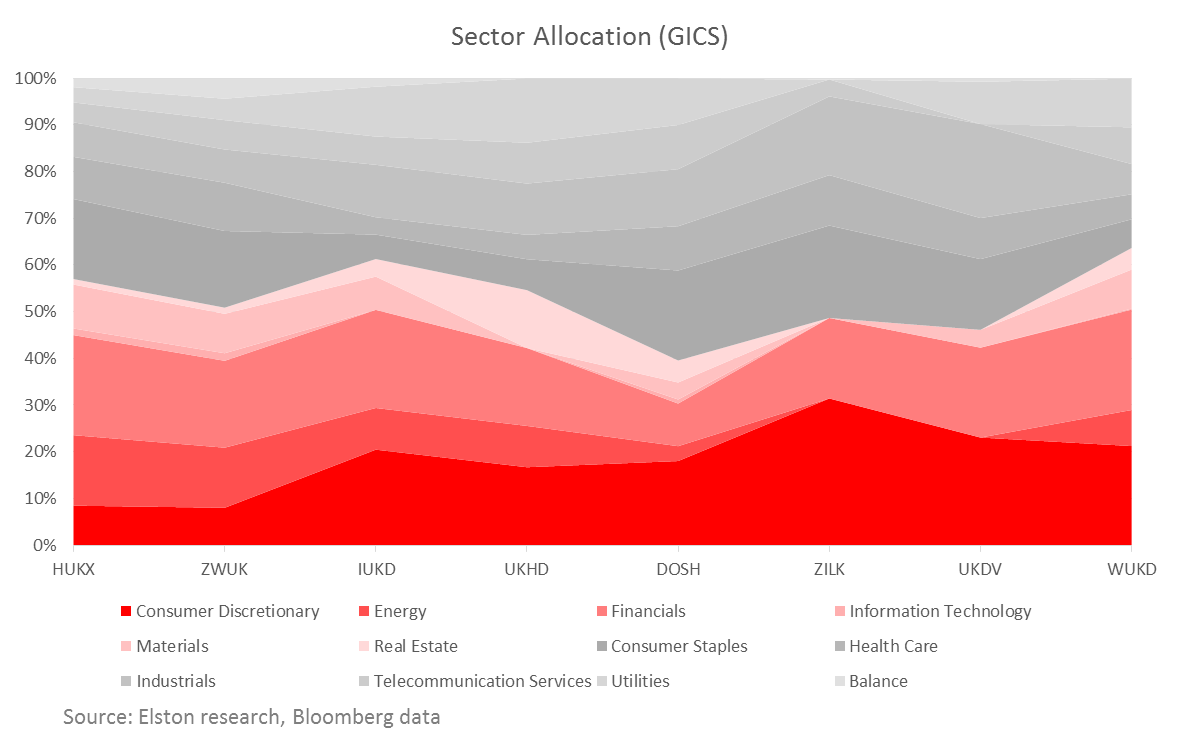 Conclusion
There is more to UK Equity Income than yield alone, by understanding the look-through sector exposures of the available UK Equity Income ETFs, investors can make more informed decisions as regards ETF selection that is consistent with their preferences, and client needs. NOTICES I/we have no positions in any stocks mentioned, and no plans to initiate any positions within the next 72 hours. I wrote this article myself, and it expresses my own opinions. I am not receiving compensation for it. This article has been written for a US and UK audience. Tickers are shown for corresponding and/or similar ETFs prefixed by the relevant exchange code, e.g. “NYSEARCA:” (NYSE Arca Exchange) for US readers; “LON:” (London Stock Exchange) for UK readers. For research purposes/market commentary only, does not constitute an investment recommendation or advice, and should not be used or construed as an offer to sell, a solicitation of an offer to buy, or a recommendation for any product. This blog reflects the views of the author and does not necessarily reflect the views of Elston Consulting, its clients or affiliates. For information and disclaimers, please see www.elstonconsulting.co.uk Photo credit: N/A; Chart credit: Elston Consulting; Table credit: Elston Consulting All product names, logos, and brands are property of their respective owners. All company, product and service names used in this website are for identification purposes only. Use of these names, logos, and brands does not imply endorsement. Chart data is as at 30-Nov-17 |
ELSTON RESEARCHinsights inform solutions Categories
All
Archives
April 2024
|
 RSS Feed
Company |
Solutions |
|